
Imagine you’re holding a cup of your favorite hot beverage, feeling its warmth seep through your hands. Now picture a popsicle on a sunny day, its coolness refreshing your senses.
These everyday experiences are closely linked to a fascinating concept in science: heating and cooling curves. But what exactly do these curves reveal? You’re about to uncover how these curves visually represent the transition of substances between different states of matter.
They provide a clear picture of how heat affects solids, liquids, and gases. Understanding these curves is like having a secret map that guides you through the mysteries of temperature changes. By the end of this article, you’ll not only have a clearer grasp of these concepts but also a newfound appreciation for the invisible dance of molecules around you. Dive in, and let’s demystify what heating and cooling curves show.
Heating And Cooling Curves Basics
Heating and cooling curves are graphical representations that help you understand how substances change phase from solid to liquid to gas and vice versa. These curves are essential tools for visualizing the energy changes during these transitions. Whether you’re a science enthusiast or just curious, grasping the basics of these curves can deepen your appreciation for the physical world.
What Is A Heating Curve?
A heating curve illustrates how a substance’s temperature changes as heat is added. Starting from a solid state, the curve shows temperature increase until the melting point is reached. At this juncture, the temperature plateaus as the substance absorbs heat to transition into a liquid.
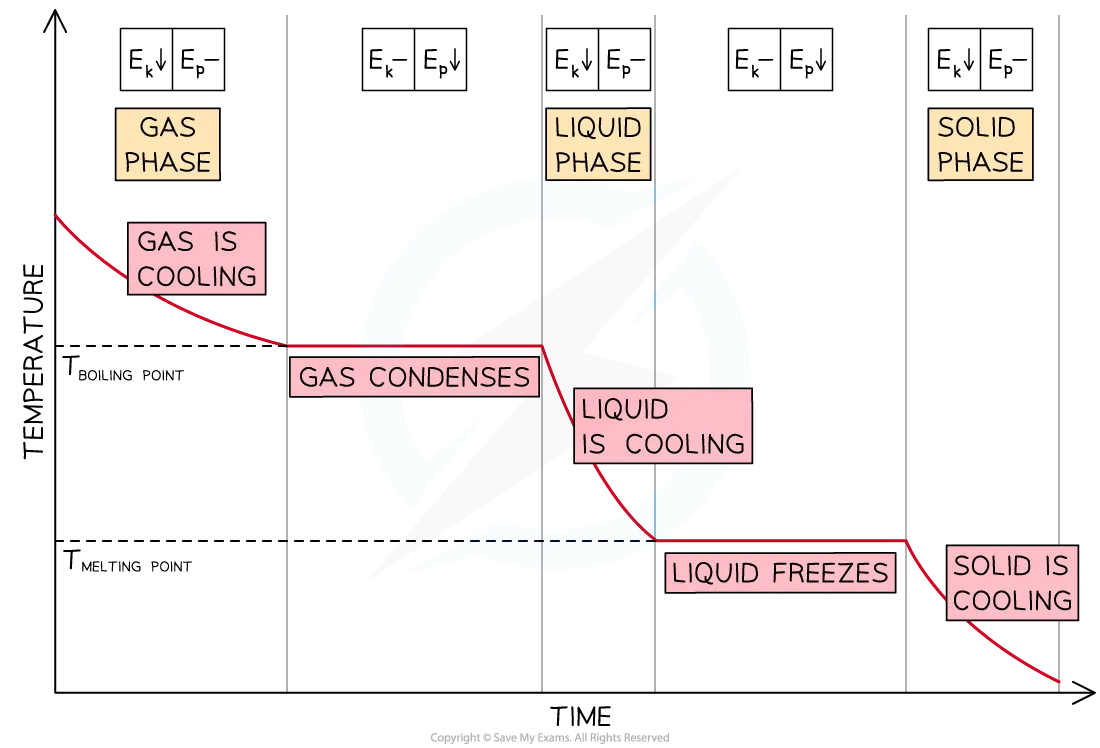
What Is A Cooling Curve?
Conversely, a cooling curve depicts the temperature decrease as heat is removed from a substance. It starts with a gas cooling down and shows how temperature remains constant as it condenses into a liquid. Further cooling leads to another plateau when the substance freezes into a solid.
Phase Changes And Plateaus
During phase changes, the temperature doesn’t change even though heat energy is being absorbed or released. This plateau phase is crucial; it indicates that energy is being used to change the state rather than increase temperature. Have you ever noticed ice melting without the water getting warmer?
Why Do We Care About Heating And Cooling Curves?
Heating and cooling curves are not just academic exercises; they have practical applications. Understanding them can help you make informed decisions in daily life. Think about cooking: when boiling water, you’re witnessing a heating curve firsthand. It’s fascinating, isn’t it?
Real-world Applications
These curves play a vital role in industries like food processing, material science, and even meteorology. For instance, refrigeration relies on the principles illustrated by cooling curves. Next time you grab a cold drink, remember the science behind keeping it chilled!
Consider This
Reflect on how these curves apply to your surroundings. Have you ever wondered why ice packs are effective in treating injuries? It’s all about the cooling curve. Recognizing the science in everyday objects can spark curiosity and lead to deeper understanding.
Credit: www.savemyexams.com
Phases Of Matter
Heating and cooling curves illustrate how a substance changes phases with temperature variations. They show transitions between solid, liquid, and gas as heat is added or removed. Understanding these curves helps explain the physical states of matter.
Understanding the phases of matter is essential in grasping how heating and cooling curves work. These curves visually represent how a substance changes state in response to temperature variations. As you explore this concept, consider the transitions between solids, liquids, and gases. Each phase offers unique characteristics, influencing how matter behaves under different conditions. By examining these transitions closely, you can gain insights into everyday phenomena, such as melting ice or boiling water, which are far more complex than they first appear.
Solid, Liquid, Gas Transitions
The transition from solid to liquid, and then to gas, is a fascinating journey. When a solid is heated, its particles vibrate more vigorously until they break free from their rigid structure, transforming into a liquid. This process, known as melting, is a tangible example of energy overcoming molecular bonds. As the temperature rises further, the liquid particles gain enough energy to escape into a gaseous state. This transition, called vaporization, is what happens when you boil water for your tea. It’s intriguing to think that the same molecules in your ice cube can eventually become steam. Have you ever wondered why the same substance can exist in different forms just by altering the temperature? This transformation is a testament to the dynamic nature of matter.
Phase Change Points
Phase change points are critical milestones in the heating and cooling curve. These points, such as the melting and boiling points, are where a substance changes its state. At these temperatures, energy input goes into breaking intermolecular forces rather than raising the temperature. Consider the melting point of ice. At 0°C, ice absorbs heat without a rise in temperature until it fully transitions to water. Similarly, at the boiling point, water absorbs heat to become steam without a temperature increase. Understanding these points helps you predict and control phase transitions in daily life. Have you noticed how water remains at a consistent temperature while boiling until it all turns to steam? These consistent temperatures are the phase change points, marking the transition with precision. By recognizing these shifts, you can better appreciate the subtle science behind everyday occurrences.
Plateaus And Temperature Stability
Heating and cooling curves are essential tools in understanding temperature changes. They reveal the fascinating process of temperature stability and transitions. The plateaus on these graphs signify critical moments where substances absorb or release energy. These periods are crucial for understanding how matter changes state.
Understanding Plateaus
Plateaus on a heating or cooling curve represent periods of temperature stability. During these times, a substance undergoes a phase change. The temperature remains constant despite energy input or removal. This stability occurs because the energy alters the substance’s state instead of its temperature. Plateaus are vital for predicting material behavior in different conditions.
Energy Absorption And Release
During plateaus, substances absorb or release energy without temperature change. This energy is used for breaking or forming molecular bonds. For instance, when ice melts, energy breaks the bonds between water molecules. The temperature stays the same until all ice turns to water. Similarly, during freezing, energy is released as bonds form. Understanding this process helps in various applications, like designing efficient heating systems.

Credit: www.teacherspayteachers.com
Heat Energy And Phase Changes
Heating and cooling curves illustrate how heat energy affects phase changes. These curves show temperature variations as substances transition between solid, liquid, and gas phases. Observing these curves helps understand how energy influences state changes.
Heat energy plays a vital role in phase changes. This is where substances transition between solid, liquid, and gas states. During these transformations, heating and cooling curves illustrate how temperature and heat energy interact. These curves are crucial for understanding the latent heat and specific heat capacities of substances.
Latent Heat Concept
Latent heat is the energy absorbed or released during a phase change. It doesn’t change the temperature. Instead, it alters the substance’s state. This concept is key in understanding phase transitions. During melting or boiling, latent heat allows the substance to change form. No temperature change occurs until the entire phase change is complete.
Heat Of Fusion And Vaporization
Heat of fusion refers to the energy needed to change a solid into a liquid. This occurs at the melting point. The curve remains flat during this process. Heat of vaporization involves transforming a liquid into a gas. This phase change happens at the boiling point. Both concepts are pivotal in studying thermal properties. Understanding them helps in various scientific and industrial applications.
Interpreting Curves
Heating and cooling curves are essential graphs in science. They show the changes in temperature as a substance heats up or cools down. Understanding these curves helps us learn about phase changes, like melting or boiling. Each section of the curve tells a different story.
Identifying Key Features
Key features of the curves include flat sections and slopes. Flat sections show phase changes. During these times, temperature stays constant. Energy is used to change the state, not to change temperature. For example, ice melting to water shows a flat line. Slopes indicate a change in temperature, either rising or falling. Each phase, solid, liquid, or gas, has its own slope.
Real-world Applications
These curves help in many real-world applications. Engineers use them to design heating systems. They ensure precise temperature control. Chemists rely on them to understand substances better. This helps in creating new materials. Food industry professionals use them for storage and processing. Knowing the right temperatures ensures food safety. These curves guide industries in improving products and processes.
Factors Affecting Curves
Understanding heating and cooling curves can be a fascinating dive into the world of thermodynamics. These curves graphically represent the phase changes and temperature variations of substances as they absorb or release heat. Factors affecting these curves can reveal a lot about the behavior of materials under different conditions. Let’s explore how pressure and substance properties can alter these curves significantly.
Pressure Influence
Pressure can dramatically impact heating and cooling curves. As pressure increases, the boiling point of a substance tends to rise. This means that the curve will show a longer phase transition at higher temperatures. Imagine cooking at high altitudes—water boils at a lower temperature due to reduced atmospheric pressure, affecting cooking times and techniques. Consider how pressure cookers work. They trap steam, increasing pressure and raising the boiling point, allowing food to cook faster than usual. Such practical examples emphasize the importance of pressure in altering heating and cooling dynamics.
Substance Properties
The intrinsic properties of substances play a crucial role in shaping heating and cooling curves. Every substance has a unique specific heat capacity, which dictates how much heat is required to change its temperature. Metals, for example, typically have low specific heat capacities, making them quick to heat up and cool down. Meanwhile, water’s high specific heat capacity means it absorbs and retains heat more effectively. This property is why coastal areas have milder climates—water moderates temperature changes. Reflect on how these properties affect everyday phenomena around you. Isn’t it intriguing how the same heat source can produce vastly different results depending on the material?
Practical Applications
Heating and cooling curves are vital in understanding temperature changes in substances. These curves provide insights into phase changes, melting, boiling, and freezing. Industries and sciences use them for various practical applications. Let’s explore how different fields utilize these curves.
Chemical Industry
The chemical industry relies on heating and cooling curves for efficient production. These curves help determine the energy needed for reactions. By analyzing curves, manufacturers optimize processes and reduce costs. Safety measures also improve through precise temperature control. This ensures reactions occur without hazards.
Environmental Science
Environmental science uses heating and cooling curves to study climate change. Curves show how natural substances react to temperature variations. Researchers analyze these reactions to predict environmental impacts. This data helps in creating strategies for ecological preservation. Accurate temperature readings guide scientists in understanding global warming effects.

Credit: www.teacherspayteachers.com
Frequently Asked Questions
What Does A Heating-cooling Curve Show?
A heating-cooling curve displays temperature changes as a substance absorbs or releases heat. It shows phase transitions like melting or boiling. The curve helps visualize energy changes during heating or cooling processes, aiding understanding of thermal properties.
What Is The Conclusion Of The Heating And Cooling Curve Experiment?
The heating and cooling curve experiment shows phase changes and energy flow in substances. Temperature remains constant during phase transitions, indicating energy absorption or release. This experiment helps understand states of matter and heat energy’s role in physical changes. Observations confirm predictable patterns in heating and cooling processes.
How To Interpret A Cooling Curve?
Analyze the cooling curve by observing temperature changes over time. Identify plateaus indicating phase changes. Monitor the slope for cooling rates. Plateaus represent latent heat, while sloped regions show sensible heat loss. Use these observations to understand material properties during cooling.
What Is The Significance Of The Cooling Curve?
A cooling curve shows how a substance’s temperature changes as it cools. It highlights phase changes, like freezing. Understanding the curve aids in analyzing substance properties and heat transfer processes. This is useful in fields like chemistry and material science for identifying melting and boiling points.
Conclusion
Heating and cooling curves tell us about substance changes. These curves show how substances behave with temperature shifts. Understanding them helps explain phase changes. Like melting or boiling. They illustrate energy use in these processes. Knowing this aids in scientific and everyday applications.
Such as cooking or freezing. These curves also guide us in understanding natural phenomena. For students and curious minds, they offer a clear learning path. A grasp of heating and cooling curves leads to better comprehension of physical science. Overall, they are essential in understanding the world around us.